Disclaimer: This article uses the software NeoBoard from my current employer. All opinions are my own. My employer is not responsible for any of my doings described in this article.
The whiteboard application NeoBoard has a JSON file format. JSON files can easily be generated by writing some JavaScript code. It is time to get creative as to what whiteboards can be build using code. For this article, I picked some ideas that would be super tedious or impossible to create by hand.
Pythagoras tree
Back in school, we used to program the Pythagoras tree. That was fun because you can write your code using recursion or iteration - the later being more efficient when done right. I’m no longer in school and this code won’t run often, so I picked the easier and more maintainable recursive approach.
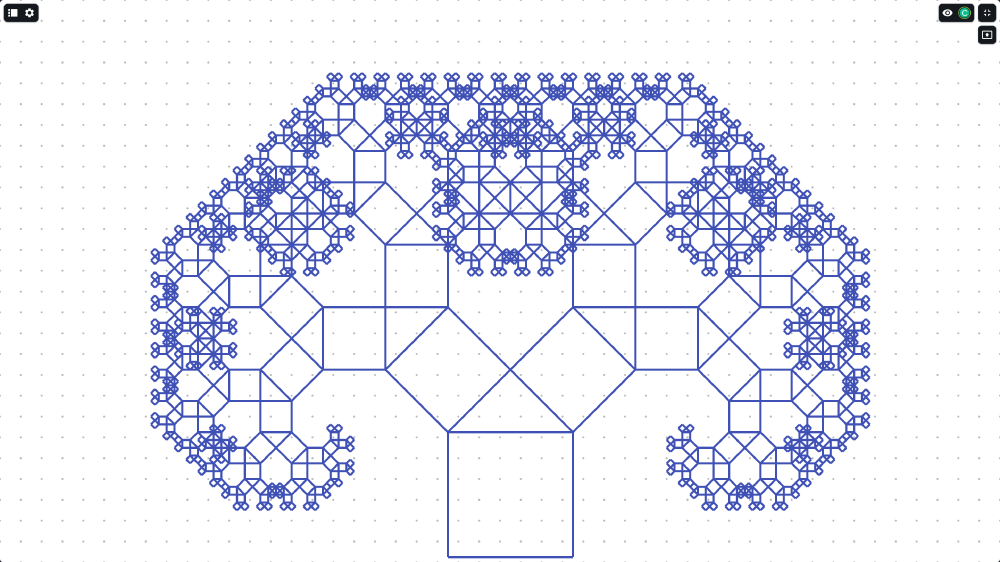
The Pythagoras tree is a quite simple fractal with an infinitely repeating pattern of squares. As a software engineer, you have to ensure it draws enough iterations to fill your screen but not too many to overwhelm your application.
The basics of generating slides
To get started, let’s create the most basic, empty whiteboard.
const document = {
    version: 'net.nordeck.whiteboard@v1',
    whiteboard: {
        slides: [
            {
                elements: [],
            },
        ],
    }
};
If you convert document to JSON and write it to a file, you get a whiteboard with one slide and no elements. So… what kind of element can we add?
const line = {
    position: {x: 1100, y: 1000},
    type: 'path',
    kind: 'line',
    strokeColor: '#3f51b5',
    points: [
        {x: 0, y: 0},
        {x: 0, y: -240},
    ],
};
Lines have two points. The position acts as an origin for all points. Knowing how to draw lines is enough to draw the Pythagoras tree.
Calendars
Working with dates often rightfully has the reputation of being super complicated. How difficult would it be to build a calendar in NeoBoard? Turns out, it was surprisingly easy.
I even got it working with JavaScript’s Date class, instead of the upcoming Temporal API which I use more often in newer projects.
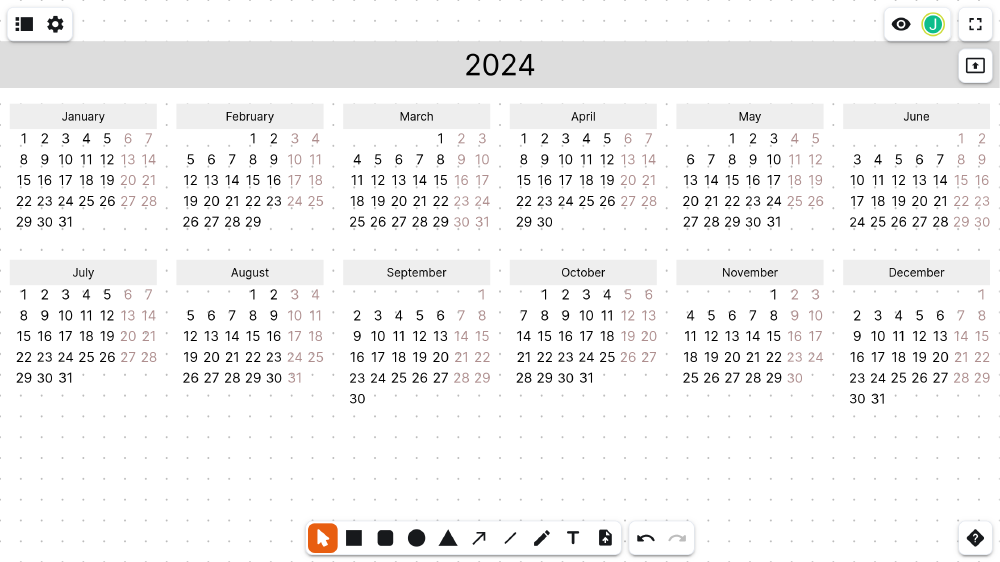
Yay! I got the current year imported into Neoboard. This calendar has all dates of the current year. During a presentation, speakers can use it to highlight important dates or date ranges.
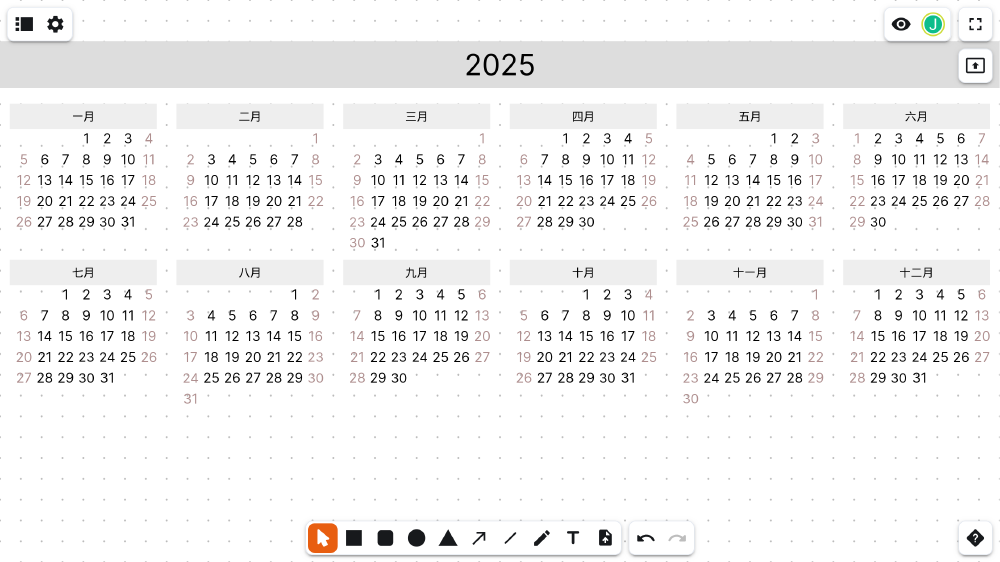
Using parameters, I can change the year, language and first day of the week. The calendar above shows the year 2025 in Chinese with Sunday as the first day of the week.
How it was done
The calendars use the rectangle shape for all its elements. Rectangles have an optional background color and text which scales to fit the size of the rectangle.
const heading = {
    position: { x: 100, y: 100 },
    type: 'shape',
    kind: 'rectangle',
    fillColor: '#dddddd',
    width: length * 8 * 6,
    height: length * 2.2,
    text: year.toString(),
};
I added the variable length to scale the calendar. By default it is set to 40 which will fill the whiteboard’s width. One could set it to 20 for allow for more calendars on one whitebard or make room for notes. The scaling feature is also available for the months.
const year = 2024;
const month = 2; // March, because months are zero-based in JS
const locale = { firstDayOfTheWeek: 0 }; // 0 = Sunday
// Track the row position
let weekInTheMonth = 0;
for (let index = 1; index <= 31; index++) {
    const date = new Date(year, month, index);
    // Skip days where `new Date` overflowed into the next month.
    if (date.getMonth() !== month) {
        continue;
    }
    // Calculate the column position
    const dayInTheWeek = ((date.getDay() - locale.firstDayOfTheWeek) + 7) % 7;
    // On the first of a week, if it's not the first of a month,
    if (dayInTheWeek === 0 && date.getDate() !== 1) {
        // we go down a row.
        weekInTheMonth++;
    }
    // Draw day
    const day = {
        position: translatedPoint(origin, dayInTheWeek * length, weekInTheMonth * length),
        type: 'shape',
        kind: 'rectangle',
        fillColor: 'transparent',
        width: length * fontScale,
        height: length * fontScale,
        text: date.getDate().toString(),
        // Adjust the colour of Saturday (6) and Sunday (0).
        ...([6,0].includes(date.getDay()) && {
            textColor: '#ae8e8e',
        }),
    };
}
To know which row and column to draw a specific day, I kept track of how many times it was the first day of a week.

I prepared a ZIP file of calendars in different locales for you to download and import into NeoBoard.