Disclaimer: TFA Dorstmann sent me an AirCO2NTROL Coach for free to test its USB capabilities and write about them.
At my former work place we used a carbon dioxide (CO₂) monitor to measure the air quality indoors. When the CO₂ concentration in a room gets too high (about 1200 parts-per-million), it becomes harder to concentrate and people may feel sleepy.
The device is powered by USB and I found reviews and libraries online saying one can read out the measurements. How I got there and how I am now using the monitor for home automation is described in this article.
Set the USB permissions (Linux only)
Being a Linux user, I had to give my user the permission to read raw values from the USB device. MacOS or Windows are less restrictive when it comes to direct hardware access.
Logged in as the user root, run the following commands. Please replace exampleusername with the user that will run the NodeJS script.
#!/bin/bash

# Add a rule to allow users in the plugdev group to access the CO₂ Monitors.
cat > /etc/udev/rules.d/98-co2mon.rules <<EOF
SUBSYSTEM=="usb", ATTRS{idVendor}=="04d9", ATTRS{idProduct}=="a052", GROUP="plugdev", MODE="0666"
KERNEL=="hidraw*", ATTRS{idVendor}=="04d9", ATTRS{idProduct}=="a052", GROUP="plugdev", MODE="0666"
EOF

# Ensure the group plugdev exists.
groupadd plugdev

# Add a user to the plugdev group to give access to plugged in devices.
usermod -a -G plugdev exampleusername

# Reinitialize device rules.
udevadm control --reload-rules && udevadm trigger
Reading the AirCO2NTROL Mini
I started with the AirCO2NTROL Mini which is the device my work place had. The NodeJS library node-co2-monitor by GitHub user huhamhire can read and decode the output of the device.
Quickly, I got the first numbers showing up on my computer screen. The device reports averaged measurements about every two seconds.
co2: 789
temp: 23.2
co2: 789
temp: 23.2
co2: 794
temp: 23.3
Henryk Plötz wrote a blog post series about how he decoded the output of the AirCO2NTROL Mini. His final article All your base are belong to us summarises his findings.
Reading the AirCO2NTROL Coach
The seller of the AirCO2NTROL Mini has several similar devices, one of which is the AirCO2NTROL Coach. Next to more accurate CO₂ readings (especially above 1500 parts-per-million) is also measures the relative humidity.
I forked the NodeJS project mentioned above to support both devices. While they share their vendor id and product id, the boards have different revision numbers. The Mini reports 1.00 (0x0100) while the Coach reports 2.00 (0x0200). It’s important to tell them apart, as only the Mini encrypts its data.
My improved node-co2-monitor supports both devices.
Values you can read
Both devices write their data in chunks of 8 bytes. If you set your transfer size to this, you’ll receive the values as quickly as possible.
Byte 1 tells you which value got transferred. Byte 2 and 3 contain the new value.
Humidity
If Byte 1 is 0x41, the humidity got transferred. Divide the value by 100 to get the relative humidity.
relativeHumidity = value / 100
Note that the AirCO2NTROL Mini sends this value but it’s always 0.
Temperature
If Byte 1 is 0x42, the temperature got transferred. Divide the value by 16 to retrieve the temperature in Kelvin.
kelvin = value / 16
celcius = value / 16 - 273.15
fahrenheit = 1.8 * (value / 16 - 273.15) + 32
Carbon dioxide
If Byte 1 is 0x50, the CO₂ concentration got transferred. The unit is parts-per-million and no transformation is needed.
co2 = value
Using it for home automation
With Mozilla IoT you can manage Things in your home and automate some processes using rules.
There are Things for browser notifications and sending e-mails or chat messages. These notifications are useful for informing you of changes, e.g. when the CO₂ concentration has risen too high.
Mozilla’s IoT Gateway software, which you can install on a Raspberry Pi board computer, is also a good way of keeping track of measurements over time.
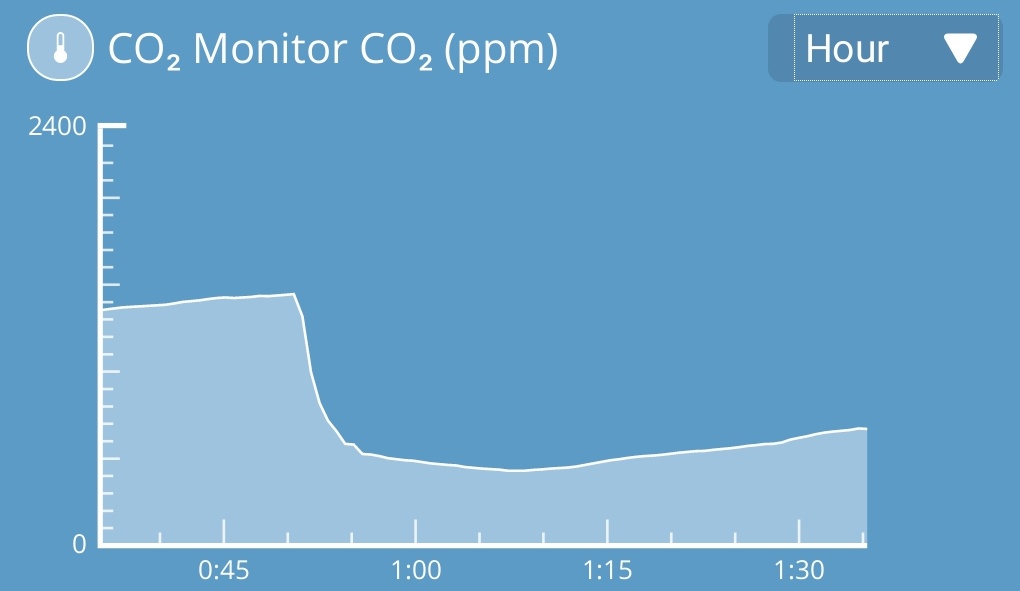
An area chart showing CO₂ concentration over the course of an hour. At 10 minutes the line drops from 2000 to 500, indicating that the room got aired. Afterwards, the line rises slowly.
The code for my, as of yet unstable, CO₂ Monitor Adapter can be found on GitLab. If your gateway runs on a Raspberry Pi, a manual step of setting the permissions as described above is required. Please message me for any help of how to avoid this extra step. I’ve also started a thread about udev rules on Mozilla’s Dicourse.
On , I talked about this at FOSDEM. The talk was called “How to build Webthings?” and a recording got published online.